A chart of accounts that scales: how to design one for a growing Dutch company
Most charts of accounts grow by accident until nobody trusts the reports. Here is how to design one that survives new entities, new products and new people.
David van Duijn7 min read

Working on this yourself? Talk to Mark, our co-founder. We’re here to solve it with you.
On this page
A chart of accounts that scales has few accounts, a numbering system with room to grow, separate accounts for every VAT treatment and clearing flow, and uses dimensions such as cost centre, project or customer for analysis instead of creating new accounts. Each account answers one question in your reports, and nothing else.
If you run finance at a company that has grown from five people to fifty, you have probably inherited a chart that grew by accident. "Marketing Google", "Marketing online" and "Advertising" sit next to each other. "Diversen" holds a tenth of all costs. Every new hire adds an account, nobody removes one, and the monthly report needs a spreadsheet to make sense.
This post is a practical guide to designing a chart that still works when you add a second entity, a new product line or a webshop. It is written for founders and finance leads who own the books, together with their accountant.
What is a chart of accounts for?
It is the list of buckets your ledger uses to classify every transaction. Each bucket ends up somewhere in your balance sheet or profit and loss. That gives you the first design rule.
An account exists to produce a line in a report. If no report, filing or control needs a separate total, you do not need a separate account.
Everything else people want to see, such as which campaign, which client or which office, belongs in a dimension. Dimensions are tags on a transaction line. They let you slice any account any way, without multiplying the list.
How should you number your accounts?
Dutch bookkeeping traditionally groups accounts in classes by their first digit, often called rubrieken. Exact layouts differ between packages, but a common pattern looks like this.
- 0 Fixed assets, equity, provisions and long-term debt
- 1 Bank, cash and short-term financial accounts, including VAT
- 2 Clearing and suspense accounts
- 3 Inventory
- 4 Operating costs
- 7 Cost of sales
- 8 Revenue
- 9 Financial and other results
Whatever scheme you pick, three things make it scale.
- Use four digits and leave gaps. Number in steps of 10 inside a range, so 4300, 4310, 4320. When a new account is needed, it fits where it belongs instead of at the end.
- Keep the same chart across entities. If you have a holding and an operating BV, or a Belgian subsidiary, every entity uses the same numbers for the same meaning. Consolidation and comparison then become a sum, not a mapping exercise.
- Never reuse a number. If an account becomes obsolete, block it for new postings and keep it. A number that meant "car lease" in 2024 and "software" in 2026 breaks every multi-year comparison.
What does a lean chart look like in practice?
Here is an excerpt for an invented 40-person services company with a webshop. Notice how short each range is.
Balance sheet
- 0100 Software and development (capitalised)
- 0200 Equipment and IT hardware
- 0210 Accumulated depreciation, equipment
- 0500 Share capital
- 0510 Retained earnings
- 1000 Bank, main current account
- 1010 Bank, savings account
- 1020 Bank, GBP account
- 1100 Trade debtors
- 1300 Trade creditors
- 1500 VAT payable, 21%
- 1510 VAT payable, 9%
- 1520 VAT, reverse charge purchases
- 1530 Input VAT
- 1540 VAT, settlement account
- 1600 Wages and payroll taxes payable
- 1700 Prepaid expenses
- 1710 Accrued income
- 1800 Accrued expenses
- 1810 Deferred income
- 2000 Payment provider clearing, Stripe
- 2010 Payment provider clearing, Mollie
- 2100 Cash in transit between own bank accounts
- 2900 Suspense, to be investigated
Profit and loss
- 4000 Salaries
- 4010 Employer social charges and pension
- 4100 Rent and facilities
- 4300 Software and subscriptions
- 4400 Marketing and advertising
- 4500 Travel
- 4600 Professional fees
- 4900 Bank and payment provider fees
- 7000 Cost of sales, services
- 7100 Cost of sales, goods
- 8000 Revenue, services, Netherlands
- 8010 Revenue, services, EU business customers
- 8100 Revenue, webshop, Netherlands
- 8110 Revenue, webshop, other EU countries
- 9000 Interest
- 9100 Exchange differences
That is 40 accounts, and it is enough for a company of this size. The detail comes from dimensions.
Which accounts are worth splitting?
Some splits are not optional, because reports and filings depend on them.
VAT, by treatment. Your Dutch VAT return (btw-aangifte) asks for separate figures, such as supplies at the standard rate in box 1a, the reduced rate in box 1b, supplies to other EU countries in 3b, purchases from other EU countries in 4b and input VAT in 5b. If your revenue and VAT accounts follow the same split, the return is a read-out, not a reconstruction. Check the exact mapping with your accountant, especially for reverse charge and webshop sales to consumers in other EU countries, which may fall under the OSS scheme.
Revenue, by what you need to steer. Split revenue by product line or channel only when the split drives a decision or a filing. Domestic versus EU is usually needed for VAT. Five product lines may be better as a dimension.
Clearing accounts, one per flow. Stripe, Mollie, PayPal and Adyen pay out net of fees and refunds, days after the sale. A clearing account per provider receives the gross sales and the fees, and the payout clears it to the bank. If the account does not return to zero (or to the payouts in transit), you have a reconciliation problem you can see.
A suspense account, used sparingly. One account for "not yet known", reviewed every week. It is a holding area, not a home.
When should you use a dimension instead of an account?
Use a dimension when you want to analyse the same kind of cost or revenue from a different angle. Typical dimensions for a growing company are:
- Cost centre or department. Sales, product, operations, management.
- Project or client. For agencies, consultancies and construction.
- Entity or location. When one ledger holds several offices.
- Vendor or customer. Usually already on the transaction through the invoice.
The test is simple. If the answer to "why is this a separate account?" is "so we can see it per team" or "per client", it is a dimension. A chart with 40 accounts and three dimensions can answer more questions than a chart with 400 accounts, and every person books the same way.
Should you use the Dutch reference chart, RGS?
The Netherlands has a standard reference chart of accounts, the Referentie GrootboekSchema or RGS. It is a standardised coding of financial data, part of the government's SBR programme for standardised business reporting, and run as a public-private collaboration. Through its taxonomy, accounts coded in RGS can be translated into SBR reports, and many accounting packages and accounting firms support it.
You do not have to rename your chart to benefit. The practical approach for most companies is to keep your own clear numbering and map each account to its RGS code. That way you keep a chart your team understands, while your accountant, bank or reporting software can read your data in a standard structure. If you are setting up a new administration from scratch, starting from an RGS-based template is a reasonable shortcut. Ask your accountant which RGS version and level of detail they work with.
How do you keep the chart clean as you grow?
- Name one owner. New accounts are requested, not created.
- Write a one-line description per account. What goes in, what does not.
- Review twice a year. Look at accounts with no postings, accounts that look alike and the size of the suspense and "other" accounts. Block what is no longer needed.
- Watch the "other costs" line. If it holds more than a few percent of total costs, something is being booked there for convenience.
- Change at a year boundary. Restructure the chart at the start of a financial year where you can, and keep a mapping from old to new so comparisons still work.
- Keep the history. Dutch businesses must keep their administration for at least seven years, so old accounts and their postings stay readable even after you block them.
How do AI agents change the chart of accounts?
Charts grow messy for a human reason. When people book, they choose the account that seems closest, and different people choose differently. Extra accounts are often an attempt to force consistency. Agents change that in a few ways.
- The same transaction lands in the same place. An agent applies your rules every time, so a lean chart stays usable and "Diversen" stops filling up.
- Dimensions get filled in. Tagging a cost centre or project on every line is tedious for people and routine for an agent, which is what makes the "dimension, not account" approach work in practice.
- Drift gets flagged. Rising balances in suspense or other costs, or postings to blocked accounts, are surfaced as exceptions rather than found at year-end.
- Restructuring is less painful. Mapping old accounts to new ones, or to RGS codes, is a well-defined task an agent can draft for your accountant to review.
- Questions don't need new accounts. If you can ask for marketing per campaign in plain language and get the answer from live numbers, you never need nine marketing accounts.
Where Thred fits
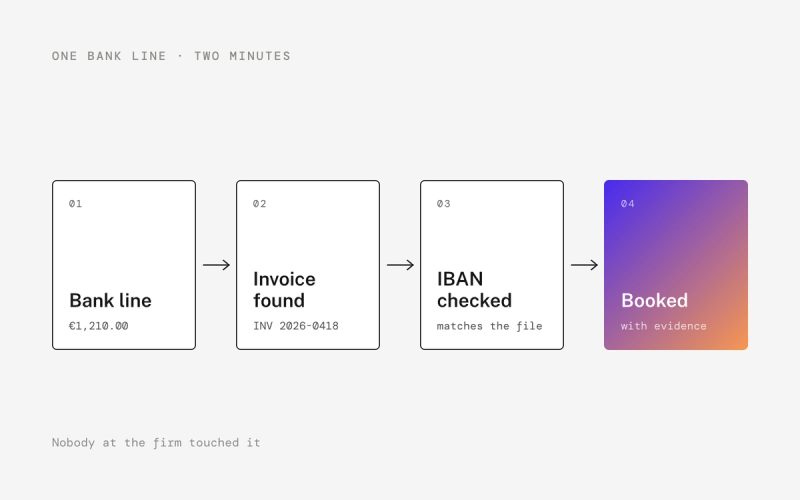
In Thred, bank lines, payments and documents are booked as they arrive, under your rules, and the same transaction is booked the same way every time, with exceptions surfaced instead of parked in "Diversen". If you are on Exact Online or another package, Thred Layer applies this on top of your existing chart. If you are outgrowing your current setup, Thred Ledger comes with white-glove migration of your opening balances and history, which is a natural moment to clean up the chart. For finance leads at growing businesses, that means reports you no longer have to fix in a spreadsheet.
Ready for a chart that your reports can rely on? Book a demo.
Frequently asked questions
How many accounts should a small company's chart of accounts have?
There is no fixed number, but a services company with a few dozen employees can usually work with around 40 to 80 accounts. If the list runs into the hundreds, many accounts are probably standing in for analysis that dimensions such as cost centre or project would handle better.
What is RGS in Dutch bookkeeping?
RGS, the Referentie GrootboekSchema, is a standardised coding of ledger accounts used in the Netherlands. It is part of the SBR programme for standardised business reporting and is governed as a public-private collaboration. Companies can use an RGS-based chart directly or map their own accounts to RGS codes.
What is the difference between an account and a dimension?
An account is a bucket that produces a line in the balance sheet or profit and loss. A dimension is a tag on a transaction, such as department, project or customer, that lets you analyse any account from another angle. Using dimensions keeps the chart short while still answering detailed questions.
Why do payment providers need their own clearing accounts?
Providers such as Stripe, Mollie and PayPal pay out net amounts days after the sales, after deducting fees and refunds. A clearing account per provider receives the gross sales and fees, and the payout clears it to the bank. A balance that does not return to the expected amount shows a reconciliation problem early.
Can I change my chart of accounts in the middle of the year?
You can, but it is cleaner to restructure at the start of a financial year and keep a mapping from old to new accounts. Block old accounts instead of deleting or reusing them, because Dutch businesses must keep their records for at least seven years and comparisons across years depend on stable numbers.